
Why PPT Exists
Most patients don’t understand gum disease until it’s too late—and most dental teams don’t have a consistent, visual way to explain it.
Traditional perio charting can feel abstract and confusing to patients. The result? Missed diagnoses, low case acceptance, and inconsistent standards between providers.
The PPT System was designed to fix that.
It turns periodontal care into a clear, visual, and structured process that anyone in the practice can understand and present confidently.
How the System Works
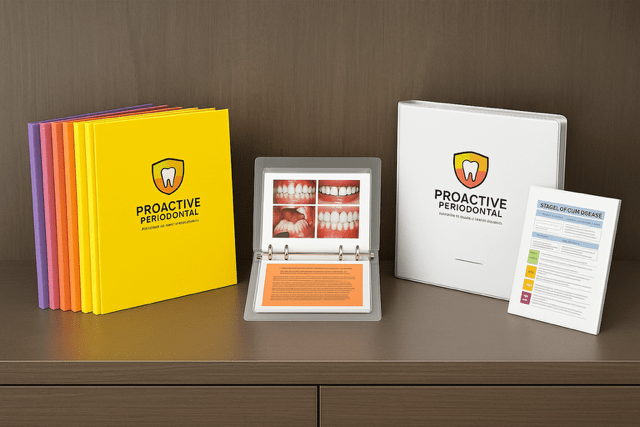
Every patient is categorized into one of four color-coded stages—each representing a distinct level of gum health and corresponding treatment pathway.
| PPT Stage | Color | Condition | Primary Focus |
|---|---|---|---|
| PPT 1 | 🟡 Yellow | Gingivitis | Prevention and inflammation control |
| PPT 2 | 🟠 Orange | Mild Periodontitis | Early intervention and risk management |
| PPT 3 | 🔴 Red | Moderate Periodontitis | Active therapy and tissue stabilization |
| PPT 4 | 🟣 Purple | Advanced Periodontitis | Comprehensive care and systemic connection |
Each stage includes its own patient folder containing tailored resources:
- Smile Report Card — A visual overview of the patient’s gum health.
- Risk Factor Management Sheet — Links lifestyle and systemic factors to periodontal risk.
- Gum Disease in Plain Terms — Simplifies complex clinical concepts.
- Recovery & Maintenance Guide — Encourages compliance and follow-through.
- Diet Log & Home-Care Challenges — Adds accountability and engagement.
Why It Works
The PPT System bridges clinical precision with emotional communication.
✅ Visual impact: Color and emotion replace confusing numbers.
✅ Consistency: Every provider diagnoses and communicates the same way.
✅ Clarity: Patients understand their condition instantly.
✅ Scalability: Easy to train, easy to replicate across multiple locations.
✅ Profitability: Elevates hygiene from a routine “cleaning” department to a predictable production engine.
For Your Team
- Doctors: Gain consistency, calibration, and leadership clarity.
- Hygienists: Follow a simple roadmap for diagnosis and education.
- Treatment Coordinators: Present perio treatment with confidence and visuals.
- Patients: Finally understand their condition, take ownership, and say “yes” to care.
Measure What Matters
With the PPT framework, offices track KPIs like:
- Periodontal treatment percentage (target: 30–40%)
- Hygiene production per day ($2,000–$2,500)
- Reappointment rate (90–95%)
- Adjunctive service rate (20–30%)
These metrics ensure the hygiene department drives both clinical outcomes and practice growth.
Transform Your Hygiene Department
When fully implemented, the PPT System turns hygiene into a predictable, data-driven, and patient-inspiring department.
Every chart, every folder, every conversation moves patients toward health—and the practice toward growth.
Start Implementing PPT in Your Office
Ready to see how it works?
